Download the 7-step guide:
The new 3.1 All-In-One TBS Report is divided into 7 steps. In the next few days, we will show you how easy it is to use the new report in daily clinical routine
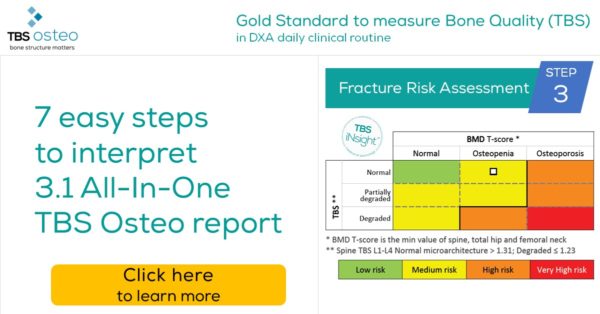
Today – STEP 3 of 7 – Fracture Risk Assessment
A color-coded grid shows the major osteoporotic fracture risk classification based on combined BMD (minimum T-score of spine, total hip, and femoral neck) and TBS categories corresponding to 3 tertiles of TBS values2. The colors of the different Bone health categories indicate the risk of fracture1
Why is this important?
Osteoporosis is defined by the WHO as low bone mass and deterioration of bone microarchitecture. BMD is an assessment of bone mass. Studies have shown that more than 50% of fractures occur in patients with normal or osteopenic BMD T-score3. TBS helps identify those patients missed by BMD alone. Both TBS and BMD and other clinical risk factors should be considered for an accurate fracture risk assessment.
What to do?
Check the white dot representing the patient’s risk of fracture based on minimum BMD T-score and TBS to identify his/her risk:
-
- Osteopenic or osteoporotic patients with degraded TBS are at high risk (orange) or very high risk (red) of fracture.
- Normal or osteopenic patients with partially degraded or normal microarchitecture are at medium (yellow) or low (green) risk of fracture.
- Note that Osteopenia and Degraded Microarchitecture may result from a secondary cause of osteoporosis.
References:
- Hans, D., Goertzen, A.L., Krieg, M.-A., Leslie, W.D., 2011. Bone microarchitecture assessed by TBS predicts osteoporotic fractures independent of bone density: the Manitoba study. J. Bone Miner. Res. 26, 2762–2769. https://doi.org/10.1002/jbmr.499.
- The TBS thresholds were defined from analysis of data from 14 prospective clinical studies (including data from: France, Germany, UK, Switzerland, Sweden, Netherlands, Canada, Australia, Hong-Kong and Japan) involving 17,809 men and women aged 40 and older. Osteoporos Int. 29, 751-758 (2018).
- Shevroja et al. J Clin Densitom 20, 334–345 (2017).
- Ulivieri, F. M. et al. Endocrine 47, 435–448 (2014).
Download the 7-step guide here:
As a reminder the main features of the 3.1 All-In-One TBS Osteo report are:
- Completely new and intuitive design to simplify the interpretation of the BMD and TBS exam.
- Bone health report – All-In-One: TBS and BMD results in one report
- New BMD T-score adjusted for TBS
- Fracture risk grid – A visualization of BMD and TBS combined assessment
- Automatic and editable conclusion developed by international experts to communicate easily with referring doctors
Feel free to share with your colleagues, as it helps identify more patients at risk for fracture. If you have questions, contact us at support@medimapsgroup.com – we will gladly help you.
Click here to follow us on LinkedIn.
You can find more information on all 7 steps below: